رگرسیون خطی 1

آزمایش فرضیات رگرسیون خطی در پایتون
بررسی فرضیه های مدل مانند نظر دادن به کد است. همه باید اغلب این کار را انجام دهند، اما گاهی اوقات در واقعیت نادیده گرفته می شوند. عدم انجام هر یک از این دو می تواند منجر به سردرگمی طولانی مدت، افتادن در دردسری بزرگ شود و می تواند پیامد های بسیار جدی ناشی از عدم تفسیر صحیح مدل داشته باشد.
رگرسیون خطی یک ابزار اساسی است که مزایای مشخصی نسبت به سایر الگوریتم های رگرسیون دارد. به دلیل سادگی اش، این یک الگوریتم فوق العاده سریع برای آموزش است، بنابراین معمولا آن را به یک الگوریتم پایه خوب برای سناریو های رگرسیون رایج تبدیل می کند. مهم تر از آن، مدل هایی که با رگرسیون خطی آموزش داده شده اند، قابل تفسیر ترین نوع مدل های رگرسیون موجود هستند – به این معنی که انجام اقدام هایی از نتایج یک مدل رگرسیون خطی آسان تر است. با این حال، اگر فرضیه ها برآورده نشوند، تفسیر نتایج همیشه معتبر نخواهد بود. این، بسته به برنامه می تواند بسیار خطرناک باشد. این پست حاوی کد هایی برای آزمایش های فرضیه های رگرسیون خطی و مثال هایی با مجموعه داده های واقعی و مجموعه داده های اسباب بازی است.
داده
برای مجموعه داده های دنیای واقعی خود، از مجموعه داده های قیمت خانه در بوستون از اواخر دهه 1970 استفاده خواهیم کرد. مجموعه داده اسباب بازی با استفاده از تابع scikit-learn “make_regression” ایجاد می شود که مجموعه داده ای را ایجاد می کند که باید تمام فرضیات ما را کاملا برآورده کند.
نکته ای که باید به آن توجه کرد این است که من فرض می کنم داده های پرت در این پست وبلاگ حذف شده اند. این بخش مهمی از هر تجزیه و تحلیل داده های اکتشافی است (که در این پست به منظور کوتاه نگه داشتن آن انجام نمی شود) که باید در سناریو های دنیای واقعی اتفاق بیفتد، و به ویژه داده های پرت باعث ایجاد مشکلات مهمی با رگرسیون خطی می شود. برای نمونه هایی از داده های پرت که در برازش مدل های رگرسیون خطی مشکلاتی ایجاد می کنند، «اَنسکوم کوارتِت» Anscombe’s Quartet را ببینید.
در این لینک توضیحات متغیر برای مجموعه داده مسکن بوستون از اسناد مربوطه آمده است:
CRIM: نرخ سرانه جنایت بر اساس شهر
ZN: نسبت زمین های مسکونی پهنه بندی شده برای زمین های بیش از 25000 فوت مربع.
INDUS: نسبت هکتار های تجاری غیر خرده فروشی در هر شهر.
CHAS: متغیر ساختگی رودخانه چارلز (1 اگر مسیر به رودخانه محدود می شود؛ 0 در غیر این صورت)
NOX: غلظت اکسید های نیتریک (یک قسمت در هر 10 میلیون)
RM: میانگین تعداد اتاق در هر مسکن
AGE: نسبت مسکن های مالک نشین پیش از سال 1940
DIS: فواصل وزنی تا پنج مرکز استخدامی بوستون
RAD: شاخص دسترسی به بزرگراه های شعاعی
TAX: نرخ مالیات بر دارایی با ارزش کامل به ازای هر 10000 دلار
PTRATIO: نسبت دانش آموز به معلم بر اساس شهر
1000 (Bk – 0.63)^ 2 :B که در آن Bk نسبت سیاه پوست ها بر اساس شهر است توجه: من واقعا از این متغیر خوشم نمی آید، زیرا فکر می کنم تعیین قیمت خانه بر اساس رنگ پوست افراد در یک منطقه معین در سناریوی مدل سازی پیش بینی کننده، هم بسیار غیر اخلاقی است و هم اینکه یک قومیت را به جای این که دیگران را در بر بگیرد، من را ناراحت می کند. من این متغییر را در این پست می گذارم تا کد را ساده نگه دارم، اما در یک موقعیت واقعی آن را حذف می کنم.
LSTAT: درصد موقعیت اجتماعی پایین تر از جمعیت
MEDV: میانگین ارزش مسکن های مالک نشین در 1000 دلار
import numpy as np
import pandas as pd
import matplotlib.pyplot as plt
import seaborn as sns
from sklearn import datasets
%matplotlib inline
“””
Real-world data of Boston housing prices
Additional Documentation: https://www.cs.toronto.edu/~delve/data/boston/bostonDetail.html
Attributes:
data: Features/predictors
label: Target/label/response variable
feature_names: Abbreviations of names of features
“””
boston = datasets.load_boston()
“””
Artificial linear data using the same number of features and observations as the
Boston housing prices dataset for assumption test comparison
“””
linear_X, linear_y = datasets.make_regression(n_samples=boston.data.shape[0],
n_features=boston.data.shape[1],
noise=75, random_state=46)
# Setting feature names to x1, x2, x3, etc. if they are not defined
linear_feature_names = [‘X’+str(feature+1) for feature in range(linear_X.shape[1])]
اکنون که داده ها بارگیری شده اند، بیایید پیش نمایش آن ها را مشاهده کنیم:
df = pd.DataFrame(boston.data, columns=boston.feature_names)
df[‘HousePrice’] = boston.target
df.head()
| CRIM | ZN | INDUS | CHAS | NOX | RM | AGE | DIS | RAD | TAX | PTRATIO | B | LSTAT | HOUSEPRICE | |
| 0 | 0.00632 | 18.0 | 2.31 | 0.0 | 0.538 | 6.575 | 65.2 | 4.0900 | 1.0 | 296.0 | 15.3 | 396.90 | 4.98 | 24.0 |
| 1 | 0.02731 | 0.0 | 7.07 | 0.0 | 0.469 | 6.421 | 78.9 | 4.9671 | 2.0 | 242.0 | 17.8 | 396.90 | 9.14 | 21.6 |
| 2 | 0.02729 | 0.0 | 7.07 | 0.0 | 0.469 | 7.185 | 61.1 | 4.9671 | 2.0 | 242.0 | 17.8 | 392.83 | 4.03 | 34.7 |
| 3 | 0.03237 | 0.0 | 2.18 | 0.0 | 0.458 | 6.998 | 45.8 | 6.0622 | 3.0 | 222.0 | 18.7 | 394.63 | 2.94 | 33.4 |
| 4 | 0.06905 | 0.0 | 2.18 | 0.0 | 0.458 | 7.147 | 54.2 | 6.0622 | 3.0 | 222.0 | 18.7 | 396.90 | 5.33 | 36.2 |
راه اندازی اولیه
قبل از اینکه فرضیه ها را آزمایش کنیم، باید مدل های رگرسیون خطی خود را منطبق کنیم. من یک تابع اصلی برای انجام تمام آزمایش های فرضی در پایین این متن دارم که این کار را به طور خودکار انجام می دهد، اما برای انتزاع آزمایش های فرضی برای مشاهده مستقل آن ها، باید آزمایش های مجزا را دوباره بنویسیم تا مدل آموزش دیده را به عنوان یک پارامتر بگیریم.
علاوه بر این، تعدادی از آزمایش ها از باقی مانده ها استفاده می کنند، بنابراین ما یک تابع سریع برای محاسبه باقی مانده ها می نویسیم. همچنین این باقی مانده ها یک بار در تابع اصلی در پایین صفحه محاسبه می شوند، اما این تابع اضافی برای رعایت تایپینگ (نوشتن) DRY آزمایش های مجزا است که از باقی مانده ها استفاده می کنند.
from sklearn.linear_model import LinearRegression
# Fitting the model
boston_model = LinearRegression()
boston_model.fit(boston.data, boston.target)
# Returning the R^2 for the model
boston_r2 = boston_model.score(boston.data, boston.target)
print(‘R^2: {0}’.format(boston_r2))
# Fitting the model
linear_model = LinearRegression()
linear_model.fit(linear_X, linear_y)
# Returning the R^2 for the model
linear_r2 = linear_model.score(linear_X, linear_y)
print(‘R^2: {0}’.format(linear_r2))
R^2: 0.873743725796525
def calculate_residuals(model, features, label):
“””
Creates predictions on the features with the model and calculates residuals
“””
predictions = model.predict(features)
df_results = pd.DataFrame({‘Actual’: label, ‘Predicted’: predictions})
df_results[‘Residuals’] = abs(df_results[‘Actual’]) – abs(df_results[‘Predicted’])
return df_results
همه چیز آماده است! سراغ آزمون فرضیه ها برویم.
فرضیه ها
1) خطی بودن
این فرضیه، فرض می کند که یک رابطه خطی بین پیش بینی کننده ها (مثلا متغیر ها یا ویژگی های مستقل) و متغیر پاسخ (مثلا متغیر وابسته یا برچسب) وجود دارد. و همچنین فرض می کند که پیش بینی کننده ها افزایشی هستند.
چرا ممکن است اتفاق بیفتد: ممکن است فقط یک رابطه خطی بین داده ها وجود نداشته باشد. مدل سازی تلاش برای تخمین تابعی است که یک فرآیند را توضیح می دهد، و اگر رابطه خطی وجود نداشته باشد، رگرسیون خطی برآورد گر مناسبی نخواهد بود (ایهام مد نظر).
چه تاثیری خواهد داشت: پیش بینی ها بسیار نادرست خواهند بود زیرا مدل ما مناسب نیست. این یک نقص جدی است که نباید نادیده گرفته شود.
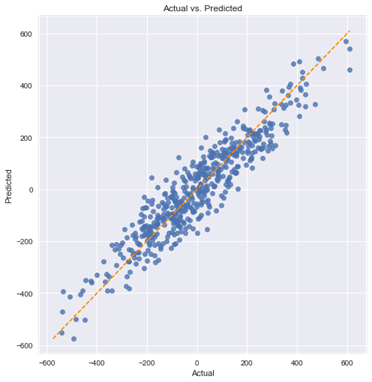
چگونه آن را تشخیص دهیم: اگر فقط یک پیش بینی وجود داشته باشد، آزمایش آن با نمودار پراکندگی بسیار آسان است. اکثر موارد چندان ساده نیستند، بنابراین باید با استفاده از نمودار پراکندگی آن را اصلاح کنیم تا مقادیر پیش بینی شده خود را در مقابل مقادیر واقعی ببینیم (به عبارت دیگر، مشاهده باقی مانده ها). در حالت ایده آل، نقاط باید بر رو یا اطراف یک خط مورب در نمودار پراکندگی قرار گیرند.
چگونه آن را برطرف کنیم: یا با اضافه کردن عبارت های چند جمله ای به برخی از پیش بینی ها یا اعمال تبدیل های غیر خطی. اگر آن ها کار نمی کنند، سعی کنید متغیر های اضافی را برای کمک به درک رابطه بین پیش بینی کننده ها و برچسب اضافه کنید.
def linear_assumption(model, features, label):
“””
Linearity: Assumes that there is a linear relationship between the predictors and
the response variable. If not, either a quadratic term or another
algorithm should be used.
“””
print(‘Assumption 1: Linear Relationship between the Target and the Feature’, ‘\n’)
print(‘Checking with a scatter plot of actual vs. predicted.’,
‘Predictions should follow the diagonal line.’)
ما با مجموعه داده خطی خود شروع خواهیم کرد:
linear_assumption(linear_model, linear_X, linear_y)
Assumption 1: Linear Relationship between the Target and the Feature
Checking with a scatter plot of actual vs. predicted. Predictions should follow the diagonal line
ما یک گسترش نسبتا یکنواخت در اطراف خط مورب ببینیم. حالا بیایید آن را با مجموعه داده بوستون مقایسه کنیم:
linear_assumption(boston_model, boston.data, boston.target)
Assumption 1: Linear Relationship between the Target and the Feature
Checking with a scatter plot of actual vs. predicted. Predictions should follow the diagonal line.
در این مورد می توانیم ببینیم که یک رابطه خطی کامل وجود ندارد. پیش بینی های ما به سمت مقادیر پایین تر در هر دو قسمت انتهای پایینی (حدود 5-10) و به ویژه در مقادیر بالاتر (بالای 40) سوگیری دارند.
2) عادی بودن شرایط خطا
به طور خاص، فرض بر این است که شرایط خطای مدل به طور معمول توزیع شده است. رگرسیون های خطی غیر از حداقل مربعات معمولی یا Ordinary Least Squares (OLS) نیز ممکن است نرمال بودن پیش بینی کننده ها یا برچسب را فرض کنند، اما در اینجا اینطور نیست.
چرا ممکن است این اتفاق بیفتد: اگر پیش بینیکننده ها یا برچسب ها به طور قابل توجهی غیر عادی باشند، این اتفاق می افتد. سایر دلایل بالقوه می تواند شامل نقض فرض خطی بودن یا تأثیر باقی مانده ها یا پرت ها بر مدل ما باشد.
چه تأثیری خواهد داشت: نقض این فرض ممکن است باعث ایجاد مشکلاتی در کاهش یا افزایش بازه های اطمینان ما شود.
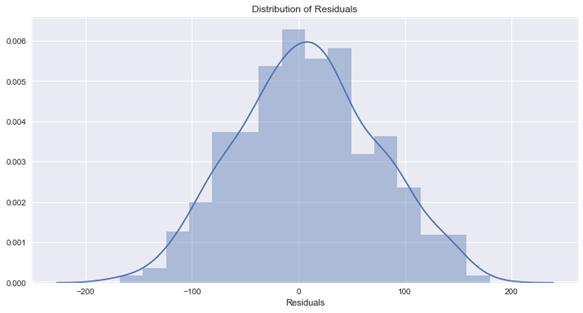
چگونه آن را تشخیص دهیم: راه های مختلفی برای انجام این کار وجود دارد، اما ما از هیستوگرام و مقدار p از تست اندرسون-دارلینگ (Anderson-Darling) برای تشخیص نرمال بودن آن استفاده می کنیم.
نحوه رفع آن: بستگی به علت اصلی دارد، اما چند گزینه وجود دارد. تبدیل غیرخطی متغیر ها، به استثنای متغیر های خاص (مانند متغیر های دنباله-بلند)، یا حذف نقاط پرت یا باقی مانده، ممکن است این مشکل را حل کند.
def normal_errors_assumption(model, features, label, p_value_thresh=0.05):
“””
Normality: Assumes that the error terms are normally distributed. If they are not,
nonlinear transformations of variables may solve this.
This assumption being violated primarily causes issues with the confidence intervals
“””
from statsmodels.stats.diagnostic import normal_ad
مانند فرضیه قبلی، ما با مجموعه داده خطی شروع می کنیم:
Assumption 2: The error terms are normally distributed
Using the Anderson-Darling test for normal distribution
p-value from the test – below 0.05 generally means non-normal: 0.335066045847
Residuals are normally distributed
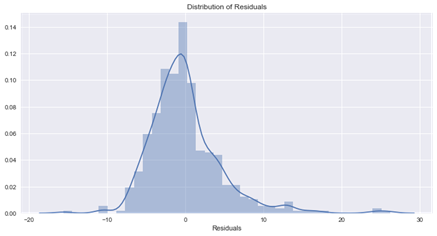
حالا بیایید همان آزمایش را روی مجموعه داده بوستون اجرا کنیم:
Assumption satisfied
normal_errors_assumption(boston_model, boston.data, boston.target)
Assumption 2: The error terms are normally distributed
Using the Anderson-Darling test for normal distribution
p-value from the test – below 0.05 generally means non-normal: 7.78748286642e-25
Residuals are not normally distributed
Assumption not satisfied
Confidence intervals will likely be affected
Try performing nonlinear transformations on variables
این نتیجه ایده آل نیست، و می توانیم ببینیم که مدل ما به سمت نا چیز پنداری سوگیری می کند.
3) عدم وجود هم خطی یا هم راستایی چندگانه در میان پیش بینی کننده ها
این فرضیه، فرض می کند که پیش بینی های مورد استفاده در رگرسیون با یکدیگر هم بستگی ندارند. این در صورت نقض مدل ما را غیرقابل استفاده نمی کند، اما باعث ایجاد مشکلاتی در قابلیت تفسیر پذیری مدل می شود.
چرا ممکن است اتفاق بیفتد: بسیاری از داده ها به طور طبیعی با هم مرتبط هستند. برای مثال، اگر بخواهیم قیمت خانه را با متراژ، تعداد اتاق خواب و حمام پیش بینی کنیم، می توان انتظار داشت که بین این سه متغیر هم بستگی وجود داشته باشد زیرا اتاق خواب و حمام بخشی از متراژ مربع را تشکیل می دهند.
چه تاثیری خواهد داشت: چند خطی بودن باعث مشکلاتی در تفسیر ضرایب می شود. به طور خاص، می توانید یک ضریب را به این صورت تفسیر کنید: «افزایش 1 در این پیش بینیکننده منجر به تغییر (ضریب) در متغیر پاسخ می شود و همه پیش بینی کننده های دیگر را ثابت نگه می دارد». این، وقتی چند خطی وجود داشته باشد مشکل ساز می شود زیرا نمی توانیم پیش بینی های هم بسته را ثابت نگه داریم. به علاوه، خطای استاندارد ضرایب را افزایش می دهد، که منجر به این می شود که زمانی که ممکن است واقعا معنی دار باشند، آن ها به طور بالقوه از نظر آماری بی اهمیت نشان داده می شوند.
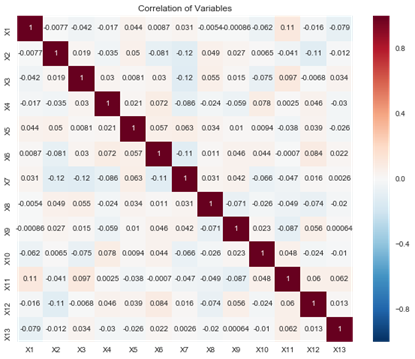
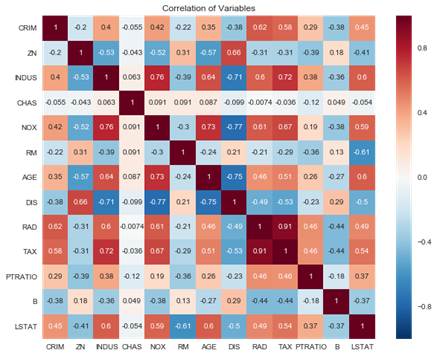
چگونه آن را تشخیص دهیم: چند راه برای انجام این کار وجود دارد، اما ما از یک نقشه حرارتی یا heatmapهم بستگی به عنوان کمک بصری استفاده می کنیم و عامل تورم واریانس (VIF) را بررسی می کنیم.
نحوه رفع آن: این می تواند توسط سایر پیش بینی کننده های حذف کننده با عامل تورم واریانس بالا (VIF) یا با اعمال کاهش ابعاد برطرف شود.
def multicollinearity_assumption(model, features, label, feature_names=None):
“””
Multicollinearity: Assumes that predictors are not correlated with each other. If there is
correlation among the predictors, then either remove prepdictors with high
Variance Inflation Factor (VIF) values or perform dimensionality reduction
This assumption being violated causes issues with interpretability of the
coefficients and the standard errors of the coefficients.
“””
from statsmodels.stats.outliers_influence import variance_inflation_factor
print(‘Assumption 3: Little to no multicollinearity among predictors’)
# Plotting the heatmap
plt.figure(figsize = (10,8))
sns.heatmap(pd.DataFrame(features, columns=feature_names).corr(), annot=True)
plt.title(‘Correlation of Variables’)
plt.show()
print(‘Variance Inflation Factors (VIF)’)
print(‘> 10: An indication that multicollinearity may be present’)
print(‘> 100: Certain multicollinearity among the variables’)
print(‘————————————-‘)
با مجموعه داده خطی شروع می کنیم:
multicollinearity_assumption(linear_model, linear_X, linear_y, linear_feature_names)
Assumption 3: Little to no multicollinearity among predictors
Variance Inflation Factors (VIF)
> 10: An indication that multicollinearity may be present
> 100: Certain multicollinearity among the variables
————————————-
X1: 1.030931170297102
X2: 1.0457176802992108
X3: 1.0418076962011933
X4: 1.0269600632251443
X5: 1.0199882018822783
X6: 1.0404194675991594
X7: 1.0670847781889177
X8: 1.0229686036798158
X9: 1.0292923730360835
X10: 1.0289003332516535
X11: 1.052043220821624
X12: 1.0336719449364813
X13: 1.0140788728975834
0 cases of possible multicollinearity
0 cases of definite multicollinearity
Assumption satisfied
همه چیز رضایت بخش به نظر می رسد. حال به سوی مجموعه داده بوستون می رویم:
multicollinearity_assumption(boston_model, boston.data, boston.target, boston.feature_names)
Assumption 3: Little to no multicollinearity among predictors
Variance Inflation Factors (VIF)
> 10: An indication that multicollinearity may be present
> 100: Certain multicollinearity among the variables
————————————-
CRIM: 2.0746257632525675
ZN: 2.8438903527570782
INDUS: 14.484283435031545
CHAS: 1.1528909172683364
NOX: 73.90221170812129
RM: 77.93496867181426
AGE: 21.38677358304778
DIS: 14.699368125642422
RAD: 15.154741587164747
TAX: 61.226929320337554
PTRATIO: 85.0273135204276
B: 20.066007061121244
LSTAT: 11.088865100659874
10 cases of possible multicollinearity
0 cases of definite multicollinearity
Assumption possibly satisfied
Coefficient interpretability may be problematic
Consider removing variables with a high Variance Inflation Factor (VIF)
این کاملا به اندازه نقض فرض عادی بودن ما فاحش نیست، اما ممکن است هم خطی بودن چندگانه برای اکثر متغیر های این مجموعه داده وجود داشته باشد.
5) عدم هم بستگی خودکار عبارات خطا
این فرضیه، می گوید که هیچ هم بستگی خودکار عبارات خطا وجود ندارد. وجود خود هم بستگی معمولا نشان می دهد که ما برخی از اطلاعاتی را که باید توسط مدل گرفته شود را از دست داده ایم.
چرا ممکن است اتفاق بیفتد: در سناریوی سری زمانی، ممکن است اطلاعاتی در مورد گذشته وجود داشته باشد که ما آن را ثبت نمی کنیم. در یک سناریوی سری های غیر زمانی، مدل ما می تواند به طور سیستماتیک با پیش بینی کمتر یا بیش از حد در شرایط خاص سوگیری داشته باشد. در نهایت، این می تواند نتیجه نقض فرضیه خطی بودن باشد.
چه تأثیری خواهد داشت: این بر برآورد های مدل ما تأثیر خواهد گذاشت.
چگونه آن را تشخیص دهیم: برای تعیین اینکه آیا هم بستگی مثبت یا منفی وجود دارد، آزمایش دوربین واتسون (Durbin-Watson test) را انجام خواهیم داد. از طرف دیگر، می توانید نمودار هایی از هم بستگی های خودکار باقی مانده ایجاد کنید.
نحوه رفع آن: اضافه کردن متغیر های تاخیر (lag) راه حلی ساده ای می باشد که می تواند این مشکل را برطرف کند. از طرفی دیگر، شرایط تعامل، متغیر های اضافی یا تبدیل های اضافی ممکن است این مشکل را برطرف کنند.
def autocorrelation_assumption(model, features, label):
“””
Autocorrelation: Assumes that there is no autocorrelation in the residuals. If there is
autocorrelation, then there is a pattern that is not explained due to
the current value being dependent on the previous value.
This may be resolved by adding a lag variable of either the dependent
variable or some of the predictors.
“””
from statsmodels.stats.stattools import durbin_watson
print(‘Assumption 4: No Autocorrelation’, ‘\n’)
# Calculating residuals for the Durbin Watson-tests
df_results = calculate_residuals(model, features, label)
print(‘\nPerforming Durbin-Watson Test’)
print(‘Values of 1.5 < d < 2.5 generally show that there is no autocorrelation in the data’)
print(‘0 to 2< is positive autocorrelation’)
print(‘>2 to 4 is negative autocorrelation’)
print(‘————————————-‘)
durbinWatson = durbin_watson(df_results[‘Residuals’])
print(‘Durbin-Watson:’, durbinWatson)
if durbinWatson < 1.5:
print(‘Signs of positive autocorrelation’, ‘\n’)
print(‘Assumption not satisfied’)
elif durbinWatson > 2.5:
print(‘Signs of negative autocorrelation’, ‘\n’)
print(‘Assumption not satisfied’)
else:
print(‘Little to no autocorrelation’, ‘\n’)
print(‘Assumption satisfied’)
آزمایش با مجموعه داده ایده آل ما:
autocorrelation_assumption(linear_model, linear_X, linear_y)
Assumption 4: No Autocorrelation
Performing Durbin-Watson Test
Values of 1.5 < d < 2.5 generally show that there is no autocorrelation in the data
0 to 2< is positive autocorrelation
>2 to 4 is negative autocorrelation
————————————-
Durbin-Watson: 2.00345051385
Little to no autocorrelation
Assumption satisfied
و سپس، آزمایش با مجموعه داده بوستون:
autocorrelation_assumption(boston_model, boston.data, boston.target)
Assumption 4: No Autocorrelation
Performing Durbin-Watson Test
Values of 1.5 < d < 2.5 generally show that there is no autocorrelation in the data
0 to 2< is positive autocorrelation
>2 to 4 is negative autocorrelation
————————————-
Durbin-Watson: 1.0713285604
Signs of positive autocorrelation
Assumption not satisfied
ما در اینجا نشانه هایی از خود هم بستگی مثبت داریم، اما باید انتظار این را داشته باشیم زیرا می دانیم مدل ما به طور مداوم پیش بینی نمی شود و فرضیه خطی بودن ما نقض می شود. از آن جایی که این مجموعه داده سری زمانی نیست، متغیر های تاخیر امکان پذیر نیستند. درعوض، ما باید اصطلاحات تعامل یا تحولات اضافی را بررسی کنیم.
6) هم واریانسی یا هم پراکنشی
این یک هم واریانسی را فرض می کند، که همان واریانس در عبارات یا شرایط خطای ما است. نا همسانی واریانس، یا همان نقض همسانی واریانس، زمانی اتفاق می افتد که ما واریانس یکسانی در بین عبارات خطا نداشته باشیم.
چرا ممکن است اتفاق بیفتد: مدل ما ممکن است به زیر مجموعه ای از داده ها وزن زیادی بدهد، به ویژه در جایی که واریانس خطا بزرگترین بوده باشد.
چه تأثیری خواهد داشت: آزمون های معنی داری (Significance tests) برای ضرایب به دلیل یک سویه (جانبدارانه) بودن خطا های استاندارد.
علاوه بر این، بازه های اطمینان یا خیلی وسیع یا خیلی باریک خواهد بود.
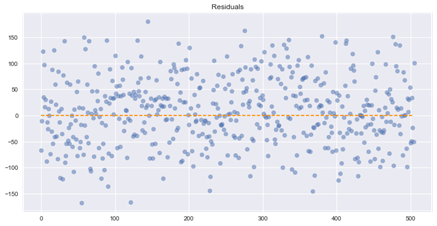
چگونه آن را تشخیص دهیم: باقی مانده ها را رسم کنید و ببینید آیا واریانس یکنواخت به نظر می رسد.
چگونه آن را برطرف کنیم: نا همگونی واریانس را می توان با استفاده از رگرسیون حداقلی مربعات وزنی (weighted least squares regression) به جای OLS استاندارد یا تبدیل متغیر های وابسته یا بسیار اریب (چوله) حل کرد. انجام تبدیل log بر روی متغیر وابسته جای خوبی برای شروع است.
def homoscedasticity_assumption(model, features, label):
“””
Homoscedasticity: Assumes that the errors exhibit constant variance
“””
print(‘Assumption 5: Homoscedasticity of Error Terms’, ‘\n’)
print(‘Residuals should have relative constant variance’)
# Calculating residuals for the plot
df_results = calculate_residuals(model, features, label)
# Plotting the residuals
plt.subplots(figsize=(12, 6))
ax = plt.subplot(111) # To remove spines
plt.scatter(x=df_results.index, y=df_results.Residuals, alpha=0.5)
plt.plot(np.repeat(0, df_results.index.max()), color=’darkorange’, linestyle=’–‘)
ax.spines[‘right’].set_visible(False) # Removing the right spine
ax.spines[‘top’].set_visible(False) # Removing the top spine
plt.title(‘Residuals’)
plt.show()
رسم باقی مانده های مجموعه داده ایده آل ما:
homoscedasticity_assumption(linear_model, linear_X, linear_y)
Assumption 5: Homoscedasticity of Error Terms
Residuals should have relative constant variance
به نظر نمی رسد هیچ مشکل آشکاری در آن وجود داشته باشد.
در مرحله بعد، با نگاهی به باقی مانده مجموعه داده بوستون:
homoscedasticity_assumption(boston_model, boston.data, boston.target)
Assumption 5: Homoscedasticity of Error Terms
Residuals should have relative constant variance
ما نمیتوانیم واریانس کاملا یکنواختی را در بین باقی مانده هایمان ببینیم، بنابراین این به طور بالقوه مشکل ساز است. با این حال، ما از آزمایش های دیگر خود می دانیم که مدل ما چندین مشکل دارد و در بسیاری از موارد در دست پیش بینی است.
نتیجه
ما به وضوح می توانیم ببینیم که یک مدل رگرسیون خطی در مجموعه داده بوستون تعدادی از فرضیه ها را نقض می کند که باعث مشکلات قابل توجهی در تفسیر خود مدل می شود. نقض فرضیه ها در داده های دنیای واقعی غیر عادی نیست، اما مهم است که آن ها را بررسی کنیم تا بتوانیم آنها را برطرف کنیم و یا از نقص های مدل برای ارائه نتایج یا فرآیند تصمیم گیری آگاه باشیم.
تصمیم گیری بر روی مدلی که فرضیه ها را نقض کرده است، خطرناک است زیرا این تصمیمات به طور موثر بر اساس اعداد ساختگی فرموله می شوند. نه تنها این، بلکه به دلیل تلاش برای تجربی بودن در فرآیند تصمیم گیری، احساس امنیت کاذبی را نیز ایجاد می کند. تجربه گرایی مستلزم پیگیری دقیق یا اعتبار آزمایی است، به همین دلیل است که این فرضیه ها وجود دارند و در ابتدا بیان می شوند. امید است که این کد بتواند به تسهیل روند اعتبار آزمایی و کاهش سختی آن کمک کند.
کد برای تابع اصلی
این تابع تمام تست های فرضی فهرست شده در این پست وبلاگ را انجام می دهد:
def linear_regression_assumptions(features, label, feature_names=None):
“””
Tests a linear regression on the model to see if assumptions are being met
“””
from sklearn.linear_model import LinearRegression
# Setting feature names to x1, x2, x3, etc. if they are not defined
if feature_names is None:
feature_names = [‘X’+str(feature+1) for feature in range(features.shape[1])]
print(‘Fitting linear regression’)
# Multi-threading if the dataset is a size where doing so is beneficial
if features.shape[0] < 100000:
model = LinearRegression(n_jobs=-1)
else:
model = LinearRegression()
model.fit(features, label)
# Returning linear regression R^2 and coefficients before performing diagnostics
r2 = model.score(features, label)
print()
print(‘R^2:’, r2, ‘\n’)
print(‘Coefficients’)
print(‘————————————-‘)
print(‘Intercept:’, model.intercept_)
for feature in range(len(model.coef_)):
print(‘{0}: {1}’.format(feature_names[feature], model.coef_[feature]))
print(‘\nPerforming linear regression assumption testing’)
# Creating predictions and calculating residuals for assumption tests
predictions = model.predict(features)
df_results = pd.DataFrame({‘Actual’: label, ‘Predicted’: predictions})
df_results[‘Residuals’] = abs(df_results[‘Actual’]) – abs(df_results[‘Predicted’])
def linear_assumption():
“””
Linearity: Assumes there is a linear relationship between the predictors and
the response variable. If not, either a polynomial term or another
algorithm should be used.
“””
print(‘\n=======================================================================================’)
print(‘Assumption 1: Linear Relationship between the Target and the Features’)
print(‘Checking with a scatter plot of actual vs. predicted. Predictions should follow the diagonal line.’)
# Plotting the actual vs predicted values
sns.lmplot(x=’Actual’, y=’Predicted’, data=df_results, fit_reg=False, size=7)
# Plotting the diagonal line
line_coords = np.arange(df_results.min().min(), df_results.max().max())
plt.plot(line_coords, line_coords, # X and y points
color=’darkorange’, linestyle=’–‘)
plt.title(‘Actual vs. Predicted’)
plt.show()
print(‘If non-linearity is apparent, consider adding a polynomial term’)
def normal_errors_assumption(p_value_thresh=0.05):
“””
Normality: Assumes that the error terms are normally distributed. If they are not,
nonlinear transformations of variables may solve this.
This assumption being violated primarily causes issues with the confidence intervals
“””
from statsmodels.stats.diagnostic import normal_ad
print(‘\n=======================================================================================’)
print(‘Assumption 2: The error terms are normally distributed’)
print()
print(‘Using the Anderson-Darling test for normal distribution’)
# Performing the test on the residuals
p_value = normal_ad(df_results[‘Residuals’])[1]
print(‘p-value from the test – below 0.05 generally means non-normal:’, p_value)
# Reporting the normality of the residuals
if p_value < p_value_thresh:
print(‘Residuals are not normally distributed’)
else:
print(‘Residuals are normally distributed’)
# Plotting the residuals distribution
plt.subplots(figsize=(12, 6))
plt.title(‘Distribution of Residuals’)
sns.distplot(df_results[‘Residuals’])
plt.show()
print()
if p_value > p_value_thresh:
print(‘Assumption satisfied’)
else:
print(‘Assumption not satisfied’)
print()
print(‘Confidence intervals will likely be affected’)
print(‘Try performing nonlinear transformations on variables’)
def multicollinearity_assumption():
“””
Multicollinearity: Assumes that predictors are not correlated with each other. If there is
correlation among the predictors, then either remove prepdictors with high
Variance Inflation Factor (VIF) values or perform dimensionality reduction
This assumption being violated causes issues with interpretability of the
coefficients and the standard errors of the coefficients.
“””
from statsmodels.stats.outliers_influence import variance_inflation_factor
print(‘\n=======================================================================================’)
print(‘Assumption 3: Little to no multicollinearity among predictors’)
# Plotting the heatmap
plt.figure(figsize = (10,8))
sns.heatmap(pd.DataFrame(features, columns=feature_names).corr(), annot=True)
plt.title(‘Correlation of Variables’)
plt.show()
print(‘Variance Inflation Factors (VIF)’)
print(‘> 10: An indication that multicollinearity may be present’)
print(‘> 100: Certain multicollinearity among the variables’)
print(‘————————————-‘)
# Gathering the VIF for each variable
VIF = [variance_inflation_factor(features, i) for i in range(features.shape[1])]
for idx, vif in enumerate(VIF):
print(‘{0}: {1}’.format(feature_names[idx], vif))
# Gathering and printing total cases of possible or definite multicollinearity
possible_multicollinearity = sum([1 for vif in VIF if vif > 10])
definite_multicollinearity = sum([1 for vif in VIF if vif > 100])
print()
print(‘{0} cases of possible multicollinearity’.format(possible_multicollinearity))
print(‘{0} cases of definite multicollinearity’.format(definite_multicollinearity))
print()
if definite_multicollinearity == 0:
if possible_multicollinearity == 0:
print(‘Assumption satisfied’)
else:
print(‘Assumption possibly satisfied’)
print()
print(‘Coefficient interpretability may be problematic’)
print(‘Consider removing variables with a high Variance Inflation Factor (VIF)’)
else:
print(‘Assumption not satisfied’)
print()
print(‘Coefficient interpretability will be problematic’)
print(‘Consider removing variables with a high Variance Inflation Factor (VIF)’)
def autocorrelation_assumption():
“””
Autocorrelation: Assumes that there is no autocorrelation in the residuals. If there is
autocorrelation, then there is a pattern that is not explained due to
the current value being dependent on the previous value.
This may be resolved by adding a lag variable of either the dependent
variable or some of the predictors.

دیدگاهتان را بنویسید