بصری سازی
مقدمه
بصری سازی داده ها در پایتون شاید یکی از پرکاربرد ترین ویژگی ها برای علم داده با پایتون در عصر امروز باشد. کتابخانه های پایتون دارای بسیاری از ویژگیهای مختلف است که کاربران را قادر می سازد تا تصویر سازی یا بصری سازی های بسیار سفارشی، زیبا و تعاملی ایجاد کنند.
در این مقاله، استفاده از Matplotlib، Seaborn و همچنین مقدمه ای بر بسته های جایگزین دیگری که می توانند در بصری سازی پایتون مورد استفاده قرار گیرند را پوشش خواهیم داد.
در Matplotlib و Seaborn، ما تعدادی از پرکاربردترین نمودار ها در دنیای علم داده را برای بصری سازی آسان پوشش خواهیم داد.
در ادامه مقاله، ویژگی قدرتمند دیگری در بصری سازی های پایتون، طرح فرعی، را مرور می کنیم و یک راه حل اساسی برای ایجاد طرح های فرعی را یاد خواهیم گرفت.
بسته های مفید برای بصری سازی در پایتون
Matplotlib
Matplotlib یک کتابخانه بصری سازیی در پایتون برای نمودار های دو بعدی از آرایه ها است. Matplotlib در پایتون نوشته شده است و از کتابخانه NumPy استفاده می کند. می توان از آن در پوسته های پایتون و آی پایتون، نوت بوک Jupyter و سرور های برنامه های وب استفاده کرد. Matplotlib با طیف گسترده ای از نمودار ها مانند خط، نوار، پراکندگی، هیستوگرام و غیره ارائه می شود که می تواند به ما در درک روند ها، الگو ها، همبستگی ها کمک کند. در سال 2002 توسط جان هانتر معرفی شد.
Seaborn
Seaborn یک کتابخانه مجموعه داده=محور برای ساخت نمایش های آماری در پایتون است. در بالای matplotlib و برای ایجاد بصری سازی های مختلف توسعه یافته است. با ساختار های داده پانداها یکپارچه شده است. کتابخانه به صورت داخلی نقشه برداری و تجمیع مورد نیاز را برای ایجاد تصاویری آموزنده انجام می دهد. توصیه می شود از رابط Jupyter / IPython در حالت matplotlib استفاده کنید.
Bokeh
Bokeh یک کتابخانه بصری سازی تعاملی برای مرورگرهای وب مدرن است. این کتابخانه برای دارایی های داده بزرگ یا جریانی مناسب است و می تواند برای توسعه نمودار ها و داشبورد های تعاملی استفاده شود. مجموعه گسترده ای از نمودار های بصری در کتابخانه وجود دارد که می توان از آنها برای توسعه راه حل ها استفاده کرد. این به طور نزدیک با ابزار PyData کار می کند. این کتابخانه برای ایجاد تصاویر سفارشی با توجه به موارد مورد نیاز مناسب است. تصاویر را نیز میتوان تعاملی کرد تا به مدل سناریو اگه-چی (what-if) کمک کند. همه کد ها منبع باز هستند و در GitHub در دسترس هستند.
Altair
Altair یک کتابخانه بصری سازی آماری اعلامی برای پایتون است. API Altair کاربر پسند و سازگار است و بر روی مشخصات Vega Lite JSON ساخته شده است. کتابخانه اعلانی نشان می دهد که هنگام ایجاد هر گونه تصویری، باید پیوند های بین ستون های داده را به کانال ها (محور x، محور y، اندازه، رنگ) تعریف کنیم. با کمک Altair، می توان تصاویری آموزنده با حداقل کد ایجاد کرد. Altair دارای دستور زبان بیانی از بصری سازی و تعامل است.
Plotly
plotly.py یک کتابخانه بصری سازیی تعاملی، منبع-باز، سطح-بالا، اعلانی و مبتنی بر مرورگر برای پایتون است. دارای مجموعه ای از بصری سازی مفید است که شامل نمودار های علمی، نمودار های سه بعدی، نمودار های آماری، نمودار های مالی و غیره است. نمودار های Plotly را می توان در نوت بوک های Jupyter، فایل های HTML مستقل یا میزبانی آنلاین مشاهده کرد. کتابخانه Plotly گزینه هایی را برای تعامل و ویرایش فراهم می کند. API قوی در هر دو حالت محلی و مرورگر وب کاملا کار می کند.
ggplot
ggplot پیاده سازی پایتون از گرامر گرافیک است. Grammar of Graphics به نگاشت داده ها به ویژگی های زیبایی شناختی (رنگ، شکل، اندازه) و اشیاء هندسی (نقاط، خطوط، میله ها) اشاره دارد. بلوک های ساختمانی اساسی با توجه به دستور زبان گرافیک عبارتند از داده ها، ژئومتریک (اشیاء هندسی)، آمار (تبدیل های آماری)، مقیاس، سیستم مختصات و وجه.
استفاده از ggplot در پایتون به شما این امکان را می دهد که بصری سازی های آموزنده را به صورت تدریجی توسعه دهید، ابتدا تفاوت های ظریف داده ها را درک کنید، و سپس مولفه ها را برای بهبود بازنمایی بصری تنظیم کنید.
چگونه از بصری سازی درست استفاده کنیم؟
برای استخراج اطلاعات مورد نیاز از تصاویر متفاوتی که ایجاد می کنیم، ضروری است که بر اساس نوع داده ها و سؤالاتی که سعی در درک آنها داریم از نمایش صحیح استفاده کنیم. در زیر مجموعه ای از پرکاربردترین نمایش ها را بررسی می کنیم و اینکه چگونه می توانیم از آنها به بهترین شکل استفاده کنیم.
نمودار میله ای
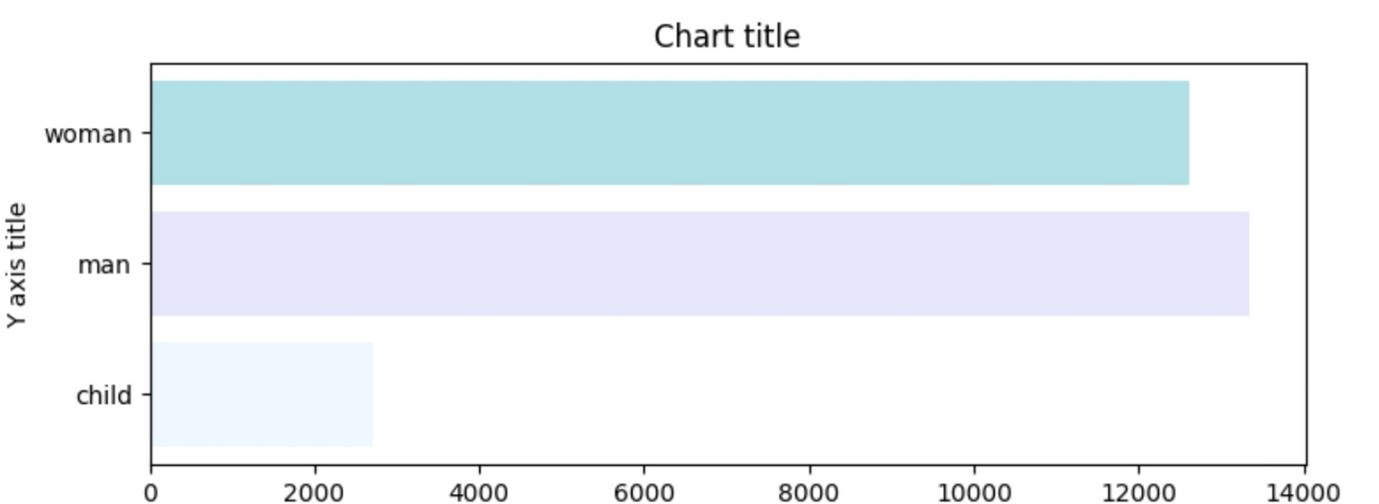
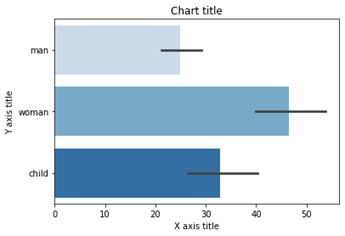
نمودار میله ای زمانی استفاده می شود که بخواهیم مقادیر متریک را در زیر گروه های مختلف داده ها مقایسه کنیم. اگر تعداد گروه ها بیشتر باشد، نمودار میله ای بر نمودار ستونی ترجیح داده می شود.
نمودار میله ای با استفاده از Matplotlib
|
#Creating the dataset df = sns.load_dataset(‘titanic’) df=df.groupby(‘who’)[‘fare’].sum().to_frame().reset_index() #Creating the bar chart plt.barh(df[‘who’],df[‘fare’],color = [‘#F0F8FF’,’#E6E6FA’,’#B0E0E6′]) #Adding the aesthetics plt.title(‘Chart title’) plt.xlabel(‘X axis title’) plt.ylabel(‘Y axis title’) #Show the plot plt.show() |
نمودار میله ای با استفاده از Seaborn
|
#Creating bar plot sns.barplot(x = ‘fare’,y = ‘who’,data = titanic_dataset,palette = “Blues”) #Adding the aesthetics plt.title(‘Chart title’) plt.xlabel(‘X axis title’) plt.ylabel(‘Y axis title’) # Show the plot plt.show()
|
نمودار ستونی
نمودار های ستونی بیشتر زمانی استفاده می شود که ما نیاز به مقایسه یک دسته از داده ها بین موارد فرعی جداگانه داریم، به عنوان مثال، هنگام مقایسه درآمد بین مناطق.
نمودار ستونی با استفاده از Matplotlib
|
#Creating the dataset df = sns.load_dataset(‘titanic’) df=df.groupby(‘who’)[‘fare’].sum().to_frame().reset_index() #Creating the column plot plt.bar(df[‘who’],df[‘fare’],color = [‘#F0F8FF’,’#E6E6FA’,’#B0E0E6′]) #Adding the aesthetics plt.title(‘Chart title’) plt.xlabel(‘X axis title’) plt.ylabel(‘Y axis title’) #Show the plot plt.show()
|
نمودار ستونی با استفاده از Seaborn
|
#Reading the dataset titanic_dataset = sns.load_dataset(‘titanic’) #Creating column chart sns.barplot(x = ‘who’,y = ‘fare’,data = titanic_dataset,palette = “Blues”) #Adding the aesthetics plt.title(‘Chart title’) plt.xlabel(‘X axis title’) plt.ylabel(‘Y axis title’) # Show the plot plt.show()
|
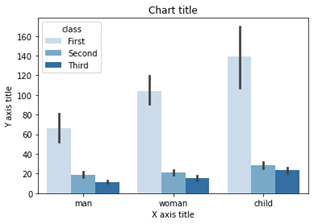
نمودار میله ای گروه بندی شده
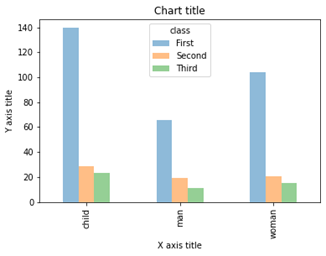
نمودار میله ای گروه بندی شده زمانی استفاده می شود که بخواهیم مقادیر را در گروه ها و زیر-گروه های خاص مقایسه کنیم
|
#Creating the dataset df = sns.load_dataset(‘titanic’) df_pivot = pd.pivot_table(df, values=”fare”,index=”who”,columns=”class”, aggfunc=np.mean) #Creating a grouped bar chart ax = df_pivot.plot(kind=”bar”,alpha=0.5) #Adding the aesthetics plt.title(‘Chart title’) plt.xlabel(‘X axis title’) plt.ylabel(‘Y axis title’) # Show the plot plt.show()
|
نمودار میله ای گروه بندی شده با استفاده از Matplotlib
نمودار میله ای گروه بندی شده با استفاده از Seaborn
|
#Reading the dataset titanic_dataset = sns.load_dataset(‘titanic’) #Creating the bar plot grouped across classes sns.barplot(x = ‘who’,y = ‘fare’,hue = ‘class’,data = titanic_dataset, palette = “Blues”) #Adding the aesthetics plt.title(‘Chart title’) plt.xlabel(‘X axis title’) plt.ylabel(‘Y axis title’) # Show the plot plt.show()
|
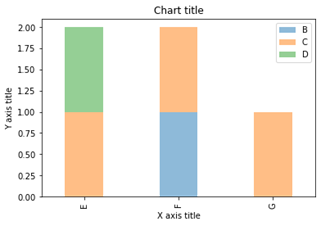
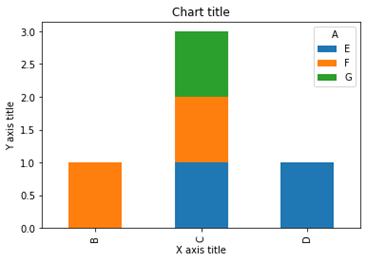
نمودار میله ای انباشته
نمودار میله ای انباشته زمانی استفاده می شود که بخواهیم کل اندازه ها را در گروه های موجود و ترکیب زیر گروه های مختلف مقایسه کنیم.
نمودار میله ای انباشته با استفاده از Matplotlib
|
# Stacked bar chart #Creating the dataset df = pd.DataFrame(columns=[“A”,”B”, “C”,”D”], data=[[“E”,0,1,1], [“F”,1,1,0], [“G”,0,1,0]]) df.plot.bar(x=’A’, y=[“B”, “C”,”D”], stacked=True, width = 0.4,alpha=0.5) #Adding the aesthetics plt.title(‘Chart title’) plt.xlabel(‘X axis title’) plt.ylabel(‘Y axis title’) #Show the plot plt.show()
|
نمودار میله ای انباشته با استفاده از Seaborn
|
dataframe = pd.DataFrame(columns=[“A”,”B”, “C”,”D”], data=[[“E”,0,1,1], [“F”,1,1,0], [“G”,0,1,0]]) dataframe.set_index(‘A’).T.plot(kind=’bar’, stacked=True) #Adding the aesthetics plt.title(‘Chart title’) plt.xlabel(‘X axis title’) plt.ylabel(‘Y axis title’) # Show the plot plt.show()
|
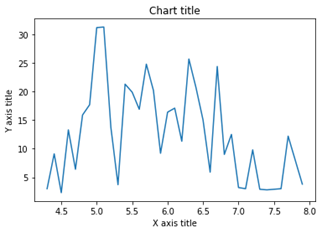
نمودار خطی
نمودار خطی برای نمایش نقاط داده پیوسته استفاده می شود. زمانی که می خواهیم روند را در طول زمان درک کنیم، می توان از این تصویر به طور مؤثر استفاده کرد.
|
#Creating the dataset df = sns.load_dataset(“iris”) df=df.groupby(‘sepal_length’)[‘sepal_width’].sum().to_frame().reset_index() #Creating the line chart plt.plot(df[‘sepal_length’], df[‘sepal_width’]) #Adding the aesthetics plt.title(‘Chart title’) plt.xlabel(‘X axis title’) plt.ylabel(‘Y axis title’) #Show the plot plt.show()
|
نمودار خطی با استفاده از Matplotlib
|
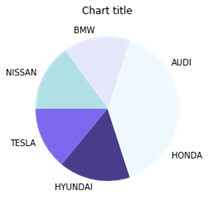
#Creating the dataset cars = [‘AUDI’, ‘BMW’, ‘NISSAN’, ‘TESLA’, ‘HYUNDAI’, ‘HONDA’] data = [20, 15, 15, 14, 16, 20] #Creating the pie chart plt.pie(data, labels = cars,colors = [‘#F0F8FF’,’#E6E6FA’,’#B0E0E6′,’#7B68EE’,’#483D8B’]) #Adding the aesthetics plt.title(‘Chart title’) #Show the plot plt.show()
|
نمودار خطی با استفاده از Seaborn
|
#Creating the dataset cars = [‘AUDI’, ‘BMW’, ‘NISSAN’, ‘TESLA’, ‘HYUNDAI’, ‘HONDA’] data = [20, 15, 15, 14, 16, 20] #Creating the pie chart plt.pie(data, labels = cars,colors = [‘#F0F8FF’,’#E6E6FA’,’#B0E0E6′,’#7B68EE’,’#483D8B’]) #Adding the aesthetics plt.title(‘Chart title’) #Show the plot plt.show()
|
نمودار دایره ای
نمودار های دایره ای می توانند برای شناسایی نسبت های اجزای مختلف در یک کل معین استفاده شوند.
نمودار دایره ای با استفاده از Matplotlib
#Creating the dataset
cars = [‘AUDI’, ‘BMW’, ‘NISSAN’,
‘TESLA’, ‘HYUNDAI’, ‘HONDA’]
data = [20, 15, 15, 14, 16, 20]
#Creating the pie chart
plt.pie(data, labels = cars,colors = [‘#F0F8FF’,’#E6E6FA’,’#B0E0E6′,’#7B68EE’,’#483D8B’])
#Adding the aesthetics
plt.title(‘Chart title’)
#Show the plot
plt.show()
نمودار مساحت
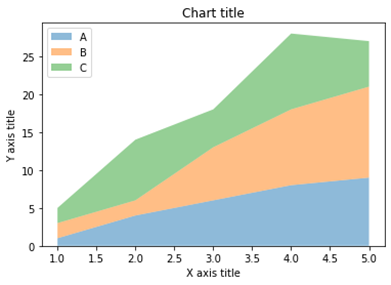
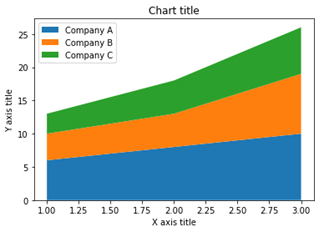
نمودار های مساحت برای ردیابی تغییرات در طول زمان برای یک یا چند گروه استفاده می شود. زمانی که بخواهیم تغییرات را در طول زمان برای بیش از 1 گروه ثبت کنیم، نمودار های ناحیه نسبت به نمودار های خطی ترجیح داده می شوند.
نمودار مساحتی با استفاده از Matplotlib
|
#Reading the dataset x=range(1,6) y=[ [1,4,6,8,9], [2,2,7,10,12], [2,8,5,10,6] ] #Creating the area chart ax = plt.gca() ax.stackplot(x, y, labels=[‘A’,’B’,’C’],alpha=0.5) #Adding the aesthetics plt.legend(loc=’upper left’) plt.title(‘Chart title’) plt.xlabel(‘X axis title’) plt.ylabel(‘Y axis title’) #Show the plot plt.show()
|
نمودار مساحت با استفاده از Seaborn
|
# Data years_of_experience =[1,2,3] salary=[ [6,8,10], [4,5,9], [3,5,7] ] # Plot plt.stackplot(years_of_experience,salary, labels=[‘Company A’,’Company B’,’Company C’]) plt.legend(loc=’upper left’) #Adding the aesthetics plt.title(‘Chart title’) plt.xlabel(‘X axis title’) plt.ylabel(‘Y axis title’) # Show the plot plt.show()
|
هیستوگرام ستونی
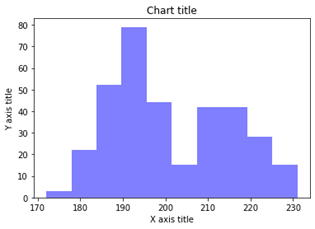
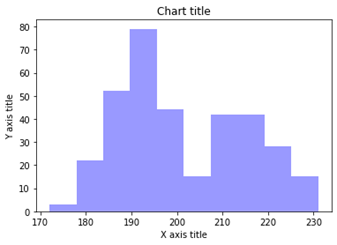
هیستوگرام های ستونی برای مشاهده توزیع برای یک متغیر منفرد با نقاط داده کمی استفاده می شود.
نمودار ستونی با استفاده از Matplotlib
|
#Creating the dataset penguins = sns.load_dataset(“penguins”) #Creating the column histogram ax = plt.gca() ax.hist(penguins[‘flipper_length_mm’], color=’blue’,alpha=0.5, bins=10) #Adding the aesthetics plt.title(‘Chart title’) plt.xlabel(‘X axis title’) plt.ylabel(‘Y axis title’) #Show the plot plt.show()
|
نمودار ستونی با استفاده از Seaborn
|
#Reading the dataset penguins_dataframe = sns.load_dataset(“penguins”) #Plotting bar histogram sns.distplot(penguins_dataframe[‘flipper_length_mm’], kde=False, color=’blue’, bins=10) #Adding the aesthetics plt.title(‘Chart title’) plt.xlabel(‘X axis title’) plt.ylabel(‘Y axis title’) # Show the plot plt.show()
|
هیستوگرام خط
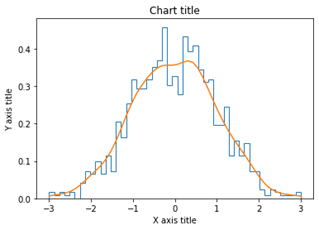
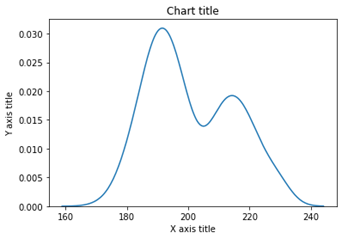
هیستوگرام خط برای مشاهده توزیع برای یک متغیر منفرد با نقاط داده بسیار زیادی استفاده می شود.
نمودار هیستوگرام خطی با استفاده از Matplotlib
|
#Creating the dataset df_1 = np.random.normal(0, 1, (1000, )) density = stats.gaussian_kde(df_1) #Creating the line histogram n, x, _ = plt.hist(df_1, bins=np.linspace(-3, 3, 50), histtype=u’step’, density=True) plt.plot(x, density(x)) #Adding the aesthetics plt.title(‘Chart title’) plt.xlabel(‘X axis title’) plt.ylabel(‘Y axis title’) #Show the plot plt.show()
|
نمودار هیستوگرام خطی با استفاده از Seaborn
|
#Reading the dataset penguins_dataframe = sns.load_dataset(“penguins”) #Plotting line histogram sns.distplot(penguins_dataframe[‘flipper_length_mm’], hist = False, kde = True, label=’Africa’) #Adding the aesthetics plt.title(‘Chart title’) plt.xlabel(‘X axis title’) plt.ylabel(‘Y axis title’) # Show the plot plt.show()
|
طرح پراکنده
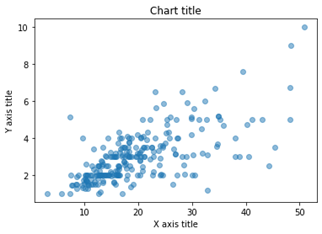
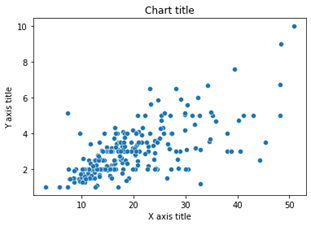
نمودار های پراکندگی می توانند برای شناسایی روابط بین دو متغیر استفاده شوند. در شرایطی که متغیر وابسته می تواند چندین مقدار برای متغیر مستقل داشته باشد، می تواند به طور موثر مورد استفاده قرار گیرد.
|
#Creating the dataset df = sns.load_dataset(“tips”) #Creating the scatter plot plt.scatter(df[‘total_bill’],df[‘tip’],alpha=0.5 ) #Adding the aesthetics plt.title(‘Chart title’) plt.xlabel(‘X axis title’) plt.ylabel(‘Y axis title’) #Show the plot plt.show()
|
نمودار پراکندگی با استفاده از Matplotlib
|
#Reading the dataset bill_dataframe = sns.load_dataset(“tips”) #Creating scatter plot sns.scatterplot(data=bill_dataframe, x=”total_bill”, y=”tip”) #Adding the aesthetics plt.title(‘Chart title’) plt.xlabel(‘X axis title’) plt.ylabel(‘Y axis title’) # Show the plot plt.show()
|
نمودار پراکندگی با استفاده از Seaborn
#Reading the dataset
bill_dataframe = sns.load_dataset(“tips”)
#Creating scatter plot
sns.scatterplot(data=bill_dataframe, x=”total_bill”, y=”tip”)
#Adding the aesthetics
plt.title(‘Chart title’)
plt.xlabel(‘X axis title’)
plt.ylabel(‘Y axis title’)
# Show the plot
plt.show()
نمودار حباب
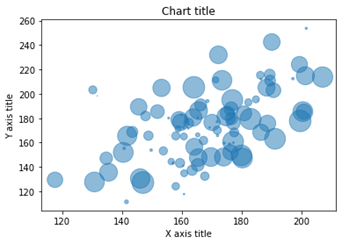
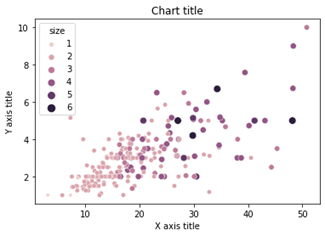
نمودار های پراکندگی می توانند برای به تصویر کشیدن و نشان دادن روابط بین سه متغیر مورد استفاده قرار گیرند.
نمودار حباب با استفاده از Matplotlib
|
#Creating the dataset np.random.seed(42) N = 100 x = np.random.normal(170, 20, N) y = x + np.random.normal(5, 25, N) colors = np.random.rand(N) area = (25 * np.random.rand(N))**2 df = pd.DataFrame({ ‘X’: x, ‘Y’: y, ‘Colors’: colors, “bubble_size”:area}) #Creating the bubble chart plt.scatter(‘X’, ‘Y’, s=’bubble_size’,alpha=0.5, data=df) #Adding the aesthetics plt.title(‘Chart title’) plt.xlabel(‘X axis title’) plt.ylabel(‘Y axis title’) #Show the plot plt.show()
|
نمودار حباب با استفاده از Seaborn
|
#Reading the dataset bill_dataframe = sns.load_dataset(“tips”) #Creating bubble plot sns.scatterplot(data=bill_dataframe, x=”total_bill”, y=”tip”, hue=”size”, size=”size”) #Adding the aesthetics plt.title(‘Chart title’) plt.xlabel(‘X axis title’) plt.ylabel(‘Y axis title’) # Show the plot plt.show()
|
طرح جعبه
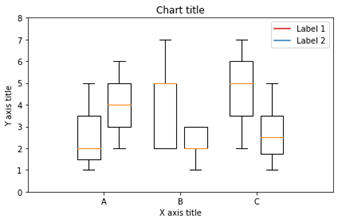
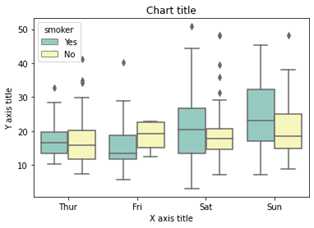
نمودار جعبه ای برای نشان دادن شکل توزیع، مقدار مرکزی و تغییر پذیری آن استفاده می شود.
نمودار جعبه با استفاده از Matplotlib
|
from past.builtins import xrange #Creating the dataset df_1 = [[1,2,5], [5,7,2,2,5], [7,2,5]] df_2 = [[6,4,2], [1,2,5,3,2], [2,3,5,1]] #Creating the box plot ticks = [‘A’, ‘B’, ‘C’] plt.figure() bpl = plt.boxplot(df_1, positions=np.array(xrange(len(df_1)))*2.0-0.4, sym=”, widths=0.6) bpr = plt.boxplot(df_2, positions=np.array(xrange(len(df_2)))*2.0+0.4, sym=”, widths=0.6) plt.plot([], c=’#D7191C’, label=’Label 1′) plt.plot([], c=’#2C7BB6′, label=’Label 2′) #Adding the aesthetics plt.title(‘Chart title’) plt.xlabel(‘X axis title’) plt.ylabel(‘Y axis title’) plt.legend() plt.xticks(xrange(0, len(ticks) * 2, 2), ticks) plt.xlim(-2, len(ticks)*2) plt.ylim(0, 8) plt.tight_layout() #Show the plot plt.show()
|
طرح جعبه با استفاده از Seaborn
|
#Reading the dataset bill_dataframe = sns.load_dataset(“tips”) #Creating boxplots ax = sns.boxplot(x=”day”, y=”total_bill”, hue=”smoker”, data=bill_dataframe, palette=”Set3″) #Adding the aesthetics plt.title(‘Chart title’) plt.xlabel(‘X axis title’) plt.ylabel(‘Y axis title’) # Show the plot plt.show()
|
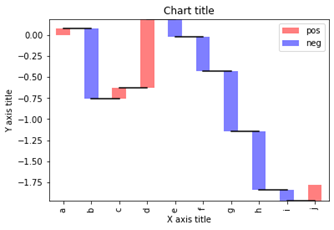
نمودار آبشار
نمودار آبشار را می توان برای توضیح انتقال تدریجی در مقدار متغیری که در معرض افزایش یا کاهش است، استفاده کرد.
|
#Reading the dataset test = pd.Series(-1 + 2 * np.random.rand(10), index=list(‘abcdefghij’)) #Function for makig a waterfall chart def waterfall(series): df = pd.DataFrame({‘pos’:np.maximum(series,0),’neg’:np.minimum(series,0)}) blank = series.cumsum().shift(1).fillna(0) df.plot(kind=’bar’, stacked=True, bottom=blank, color=[‘r’,’b’], alpha=0.5) step = blank.reset_index(drop=True).repeat(3).shift(-1) step[1::3] = np.nan plt.plot(step.index, step.values,’k’) #Creating the waterfall chart waterfall(test) #Adding the aesthetics plt.title(‘Chart title’) plt.xlabel(‘X axis title’) plt.ylabel(‘Y axis title’) #Show the plot plt.show()
|
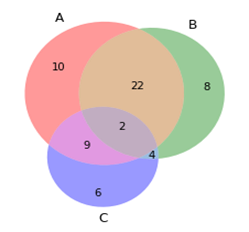
نمودار Venn
|
from matplotlib_venn import venn3 #Making venn diagram venn3(subsets = (10, 8, 22, 6,9,4,2)) plt.show()
|
نمودارهای ون برای مشاهده روابط بین دو یا سه مجموعه از آیتم ها استفاده می شود. شباهت ها و تفاوت ها را برجسته می کند.
نقشه درختی
|
import squarify sizes = [40, 30, 5, 25, 10] squarify.plot(sizes) #Adding the aesthetics plt.title(‘Chart title’) plt.xlabel(‘X axis title’) plt.ylabel(‘Y axis title’) # Show the plot plt.show()
|
نقشه های درختی عمدتا برای نمایش داده هایی استفاده می شوند که در یک ساختار سلسله مراتبی گروه بندی و تودرتو هستند و سهم هر جزء را مشاهده می کنند.
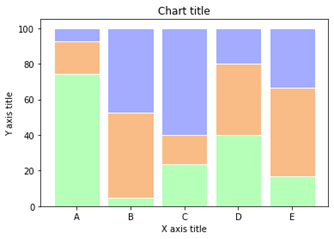
نمودار میله ای 100% انباشته
زمانی که می خواهیم تفاوت های نسبی را در هر گروه برای زیرگروه های مختلف در دسترس نشان دهیم، می توان از نمودار میلهای 100% انباشته استفاده کرد.
|
#Reading the dataset r = [0,1,2,3,4] raw_data = {‘greenBars’: [20, 1.5, 7, 10, 5], ‘orangeBars’: [5, 15, 5, 10, 15],’blueBars’: [2, 15, 18, 5, 10]} df = pd.DataFrame(raw_data) # From raw value to percentage totals = [i+j+k for i,j,k in zip(df[‘greenBars’], df[‘orangeBars’], df[‘blueBars’])] greenBars = [i / j * 100 for i,j in zip(df[‘greenBars’], totals)] orangeBars = [i / j * 100 for i,j in zip(df[‘orangeBars’], totals)] blueBars = [i / j * 100 for i,j in zip(df[‘blueBars’], totals)] # plot barWidth = 0.85 names = (‘A’,’B’,’C’,’D’,’E’) # Create green Bars plt.bar(r, greenBars, color=’#b5ffb9′, edgecolor=’white’, width=barWidth) # Create orange Bars plt.bar(r, orangeBars, bottom=greenBars, color=’#f9bc86′, edgecolor=’white’, width=barWidth) # Create blue Bars plt.bar(r, blueBars, bottom=[i+j for i,j in zip(greenBars, orangeBars)], color=’#a3acff’, edgecolor=’white’, width=barWidth) # Custom x axis plt.xticks(r, names) plt.xlabel(“group”) #Adding the aesthetics plt.title(‘Chart title’) plt.xlabel(‘X axis title’) plt.ylabel(‘Y axis title’) plt.show()
|
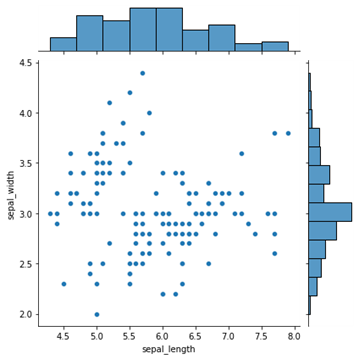
نمودار حاشیه ای یا کناری
|
#Reading the dataset iris_dataframe = sns.load_dataset(‘iris’) #Creating marginal graphs sns.jointplot(x=iris_dataframe[“sepal_length”], y=iris_dataframe[“sepal_width”], kind=’scatter’) # Show the plot plt.show()
|
نمودار های حاشیه ای برای ارزیابی رابطه بین دو متغیر و بررسی توزیع آنها استفاده می شود. چنین نمودار ها، نمودار هایی را پراکنده می کنند که دارای هیستوگرام، نمودار جعبه یا نمودار نقطه ای در حاشیه محور های x و y هستند.
طرح های فرعی
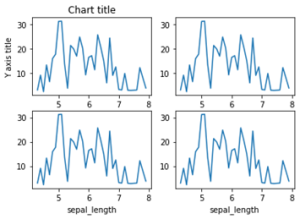
طرح های فرعی بصری سازی های قدرتمندی هستند که به مقایسه آسان بین طرح ها کمک می کنند.
|
#Creating the dataset df = sns.load_dataset(“iris”) df=df.groupby(‘sepal_length’)[‘sepal_width’].sum().to_frame().reset_index() #Creating the subplot fig, axes = plt.subplots(nrows=2, ncols=2) ax=df.plot(‘sepal_length’, ‘sepal_width’,ax=axes[0,0]) ax.get_legend().remove() #Adding the aesthetics ax.set_title(‘Chart title’) ax.set_xlabel(‘X axis title’) ax.set_ylabel(‘Y axis title’) ax=df.plot(‘sepal_length’, ‘sepal_width’,ax=axes[0,1]) ax.get_legend().remove() ax=df.plot(‘sepal_length’, ‘sepal_width’,ax=axes[1,0]) ax.get_legend().remove() ax=df.plot(‘sepal_length’, ‘sepal_width’,ax=axes[1,1]) ax.get_legend().remove() #Show the plot plt.show()
|
در نتیجه، مجموعه ای از کتابخانه های مختلف وجود دارد که می توان با درک موارد استفاده و نیاز، از پتانسیل کامل آنها استفاده کرد. نحو و معنا شناسی از بسته ای به بسته دیگر متفاوت است و درک چالش ها و مزایای کتابخانه های مختلف ضروری است./



دیدگاهتان را بنویسید